
I've mentioned before that I've been "charing my cycles," and I'm sure that many of you have been wondering what that means. To chart your cycles means to take your basal body temperature every morning at the same time, to see when you've ovulated. FertiltiyFriend defines your basal body temperature (BBT) as: "Your body temperature at rest as measured with a special Basal Body Temperature thermometer. A rise in BBT occurs after ovulation making BBT the only fertility sign that is useful for pinpointing the actual day of ovulation."
Many couples use charting as a way of "natural" family planning, instead of using birth control. By taking your BBT and charting it, as well as other bodily signs, you can tell when your body is about to ovulate, did ovulate, and if you're pregnant. Your body temperature rises after ovulation which will show as a spike in your chart. Of course using things like ovulation predictor kits (OPKs) can also help in predicting ovulation as well.
I started charting in the beginning of November in the middle of a cycle. Normally, you start a chart at the beginning of your cycle, as soon as your period starts, but I wanted to get into the habit of rolling over and sticking a thermometer in my mouth as soon as I woke up, before I started my next cycle. I began charting as a way to see if/when I'm ovulating so that we can give ourselves every possible advantage when we actively start to try and get pregnant. Of course my current charts will not show ovulation because I'm on birth control to prevent just that, but it's a good habit to get into for when the time comes. As a note, I'm using the free version of FertilityFriend online as well as their iPhone app.
So without further adieu, my first chart!

A few notes:
- I don't have temperatures for the first three days of my cycle because I was in Atlanta for job training and my thermometer broke.
- Some temperatures show up as clear circles because they were taken at a later time than my usual 8:05 a.m. I'm sorry, but until we're actively trying, I'm not getting up early on the weekends just to shove a thermometer in my mouth.
A chart that shows pregnancy can look like the one below:
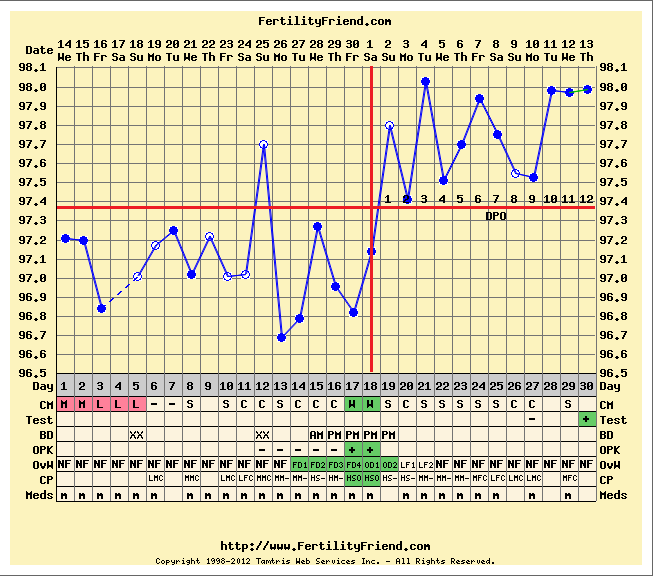
The red cross hairs show the date of ovulation (the vertical line) and the coverline (the horizontal line.) If your month ends in pregnancy, your temperature should stay above your coverline. If it dips below, there is a good chance that you're not pregnant. Of course I don't have cross hairs because I didn't ovulate this past cycle due to my birth control.
Our hopes are that for the next three months after I come off birth control, I will ovulate on my own and I will use my chart to show if/when I do. If my chart shows for three months that I have not ovulated on my own, then I will most likely go on Clomid which forces ovulation.
So that's kind of a quick run down of charting. I'm going to continue charting and posting my chart every month. If you have any questions, please, ask away! I'm by no means an expert, but I've done a fair bit of research and have been doing this for a little over two months. FertilityFriend has a lot of good information if you're interested in starting to chart yourself.
I was in no way compensated for this post. I found out about FertilityFriend from another blogger, decided to give it a try, and it quickly became my favorite fertility website. All opinions expressed are my own.
No comments:
Post a Comment